
Ever wondered if gold could shine brighter than today's unpredictable economy? Gold has had its share of ups and downs, showing highs that even surprised experts and lows that made people worried. Right now, prices are hanging steady at about $1,900 per ounce, hinting at a hopeful future. In this story, we walk through the events that shaped gold's history to explain why things might get even better soon. Let’s dive in and see what this could mean for investors and the world of finance.
Comprehensive Overview of Gold Market Trends: Past and Present
Gold market trends show us the ups and downs of gold prices over time. In the first part of 2024, gold averaged around $1,900 per ounce, a level many see as both a safe spot during uncertain times and a lively alternative to more traditional investments.
Looking back, gold’s price history has been full of ups and downs. In January 2000, gold was around $300 per ounce. Then, in September 2011, it jumped to a record high of $1,920 per ounce. It later dipped to about $1,045 per ounce in December 2015 before climbing past $2,070 per ounce in August 2020. Each of these moments shows how major world events, economic changes, and shifts in investors’ feelings have moved gold’s price over time.
Even now, with an average price keeping steady at about $1,900 per ounce, gold continues to play an important role in many investment portfolios. Investors pay close attention because gold can work as a hedge (a way to protect against risk) against rising costs and changes in currency value. In other words, as gold adjusts to outside pressures and growing demand, its price gives us clues about larger economic trends and new financial strategies.
Gold Market Trends: Promising Growth Ahead

Between 2000 and 2009, gold's value soared dramatically. Prices jumped from $272 to $1,024 per ounce, a 460% increase that really set the stage for what was to come. This vibrant burst reminds us that strong moves in the market can spark exciting shifts in future trends.
Then came the next chapter. From 2010 to 2019, gold's climb was much more modest. Prices edged from $1,105 to $1,517 per ounce, marking a slight 5% drop. This quieter performance gave the market a more calm and measured feel, showing that growth isn’t always a straight line upward.
More recently, between 2020 and 2023, gold bounced back with a 23% gain. Prices moved from $1,519 to $1,873 per ounce. Even though gold's journey isn’t perfectly smooth, each cycle reveals valuable clues about where prices might head next.
Bullion typically follows cycles that last about 8–10 years. That’s why keeping an eye on long-term trends is so important. To give you a clear picture, here’s a simple table summarizing these shifts:
| Period | Average Annual Price (approx.) | Decadal Return |
|---|---|---|
| 2000–2009 | $648/oz | +460% |
| 2010–2019 | $1,311/oz | –5% |
| 2020–2023 | $1,696/oz | +23% |
Each period tells a part of the story and shows us that even if the road looks bumpy at times, there’s always an opportunity in the cycle. Isn’t it interesting how each phase informs what might come next?
Macroeconomic and Geopolitical Drivers of Gold Market Trends

Gold prices never change on their own. They react to things like rising inflation, moves by central banks, and global events that create uncertainty. For example, back in 2008, when the US inflation rate jumped to 5.6%, gold hit $1,000 per ounce. More recently, inflation reached a peak of 7.1% in 2021–22 and gold climbed to $2,070 per ounce. And when the Ukraine conflict broke out in 2022, gold prices jumped 4% in just one month. These changes show how economic and political events can shape the gold market, even when you might not see it at first glance.
Inflation and Currency Movements
When prices for everyday goods go up, the value of a currency can drop. That’s why people often turn to gold for stability. Remember the big inflation spike in 2008? It pushed gold into exciting new territory.
Central Bank Reserves and Demand
Big decisions by major countries can really stir the market. In 2023, Russia and China added 50 tons of gold to their reserves. This move helped build confidence in gold during uncertain times.
Global Uncertainties and Safe-Haven Flows
When political tensions or economic worries rise, investors look for safe-haven assets. The Ukraine conflict is a clear example of global uncertainty that pushed gold’s price noticeably higher.
| Driver | Impact on Gold | Example |
|---|---|---|
| Inflation | Boosts gold’s appeal | 2008 CPI spike |
| Central Bank Activity | Increases demand and reserves | 50 t added in 2023 |
| Global Uncertainties | Drives safe-haven flows | Ukraine conflict push |
Gold Market Trends: Promising Growth Ahead

When you look at both short-term forecasts and long-range projections, you'll see different ideas about where gold is headed. Analysts mix technical data with trends in the economy to form their views. Some focus on quick shifts in the market, while others point to gold's long-term stability as a safe asset. Here are some key takeaways:
- Bloomberg consensus: $2,200 per ounce by Q4 2024
- Goldman Sachs prediction: $2,400 per ounce by mid-2025
- A 5-year compound annual growth rate of around 3.7%
- ETF demand increased by 15% in 2023
- Analysts expect a 12-month range between $1,800 and $2,500 per ounce
Overall, most experts agree that gold is likely to do well, especially during uncertain times, because it helps keep investment portfolios balanced. Many believe steady growth is on the horizon thanks to increasing demand and strong economic factors, though a few warn about short-term ups and downs. When you put all these views together, it’s clear that gold remains a trusted option for those looking to protect their wealth and manage risks in a changing financial world.
Technical and Trading Momentum in Precious Metal Markets
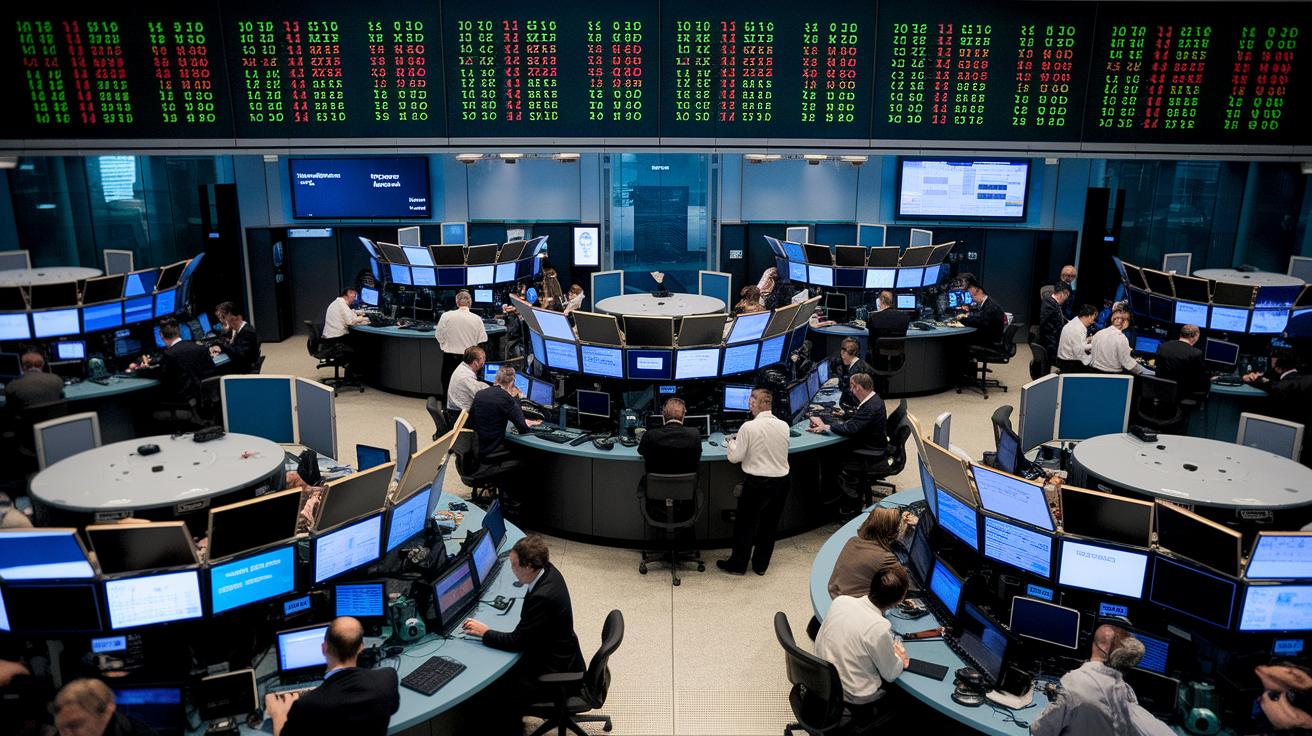
Traders keep a close watch on both trading volume and market depth to gauge where gold might be headed in the near term. Every day, roughly 250,000 gold futures contracts trade, showing that both big institutions and individual traders are active and forming opinions. Imagine a bustling trading floor where each contract reflects a distinct bet on gold’s future direction.
Key indicators add extra clues to this picture. The Relative Strength Index (RSI) is sitting around 58 on the weekly chart, which tells us that gold isn’t being pushed to extremes in buying or selling just yet. Earlier, in February 2024, the MACD (an indicator that measures momentum) crossed above its signal line, like a green light prompting traders to prepare for a possible upswing. These signals work together to help forecast short-term trends.
On top of that, the price action backs up this technical view. Gold is currently priced above its 200-day moving average at about $1,880 per ounce, a classic breakout signal that many traders see as a reason to consider new positions. It’s a clear sign that the market might be gearing up for some fresh momentum.
Regional and Digital Evolutions in Gold Market Trends

In 2023, local demand for gold kept driving the market. India and China, for example, make up about 55% of the world's jewelry purchases. Their deep cultural ties to gold and growing economies help keep prices steady even when other parts of the market wobble. This strong local need gives traders and investors a better picture of gold's performance around the world.
At the same time, digital tools are really shaking things up. Digital gold ETFs alone managed around $70 billion last year, a 40% jump from the year before! Plus, online transactions in gold grew by 35% as more people turned to the internet for their gold buys and investments. It's like technology has opened up a whole new, faster way to trade gold.
These changes are reshaping how everyone can access the market. Traditional London trading still sees about 180 tons moving each month, and when you mix that with digital trading, the market feels more flexible than ever. Investors now have more options, whether they prefer buying gold the old-fashioned way or through digital channels.
Final Words
In the action, our review traced shifts in gold pricing over recent decades, noting significant highs, lows, and key macro factors at work. The analysis highlighted how technical signals and digital growth influence price behavior and investor decisions.
This clear outlook on gold market trends blends historical data with present market indicators. It offers readers a focused perspective that bolsters confidence and invites further attention to how these trends shape our financial discussions.
